Five steps from event probability to research signal.
- 01
Consolidate event probabilities
Bring prediction-market observations into a common format, reconcile equivalent events and apply data-quality checks.
- 02
Extract information from probability changes and jumps
Apply quantitative methodology to probability repricing, distinguishing material jumps from anomalous observations and preserving point-in-time context for derived research signals.
- 03
Map events to risks and assets
Use an AI event–risk–asset graph approach to connect the probability change to direct and indirect financial exposures.
- 04
Model and validate financial impact
Use statistical and machine-learning models to study asset-specific outcomes over different horizons, evaluated through walk-forward out-of-sample research.
- 05
Deliver research and workflow outputs
Develop derived probability-change features, asset-level signals and broker-oriented monitoring outputs suited to institutional evaluation, rather than reselling raw venue feeds.
Prediction markets
Policy decisions · Geopolitics · Supply disruptions
Sudden probability repricing · Illustrative data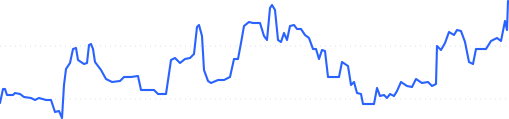

RiskGraphAI
Multi-source probability consolidation
Quantitative signal extraction
AI event–risk–asset graph
Quantitative & ML prediction models
Financial-market intelligence
Derived asset-level signals & event-risk monitoring
How could a supply event affect a financial asset?
Consider a change in the probability of a shipping disruption. The event may alter expected delivery capacity, freight costs and energy supply risks. Those risks can reach commodities, currencies and exposed equity sectors.
RiskGraphAI’s approach maps those connections, then researches whether probability changes contain information about asset outcomes at particular horizons.
Conceptual example only. It is not a live signal or a trade recommendation.
A relationship is a research question, not a guaranteed outcome.
Quantitative research evaluates whether probability repricing adds useful information about future asset moves. Walk-forward out-of-sample testing separates model development from evaluation on subsequent data.
Historical research has found statistically significant predictive relationships in selected walk-forward out-of-sample asset/horizon tests, alongside strong orthogonality to five standard price-based features across most tested combinations. Outcomes vary by asset and horizon; weaker and null results are retained in our evaluation.
We have developed and tested quantitative models. Findings are historical research evidence, not a live trading track record. AI graph enhancements and production delivery remain under development.
Evaluate prediction-market signals
for your financial-market workflow.
Request a free trial of our derived data and signals, arrange a demo, and discuss asset coverage or quantitative evaluation with us.
Free trial & discuss